Dear subscribers,
Welcome to The Bitcoin Forecast #38.
Our expectation 9 days ago was for consolidation under all-time-highs with strong support at $55k. ETH fundamentals were stronger than BTC and promised a strong rally. Since then price has remained in sideways consolidation band between $57.8k – $64.2k, while ETH has broken all-time-highs and is now in a rally clocking past $4.6k thus far.
Top level summary for 5th Nov 2021 (current price $61.1k):
Macro: Accumulation from long term holders has now peaked, it’s a bullish structure for the months ahead. I continue to monitor this metric for clues into how long this bull market phase may last.
Short term: Price was previously overheated, calling for a time of consolidation, since then we’ve seen significant buying from investors while price has been sideways. It’s been a healthy consolidation. Meanwhile significant whale activity has been spotted which suggests BTC’s next move in price may come soon.
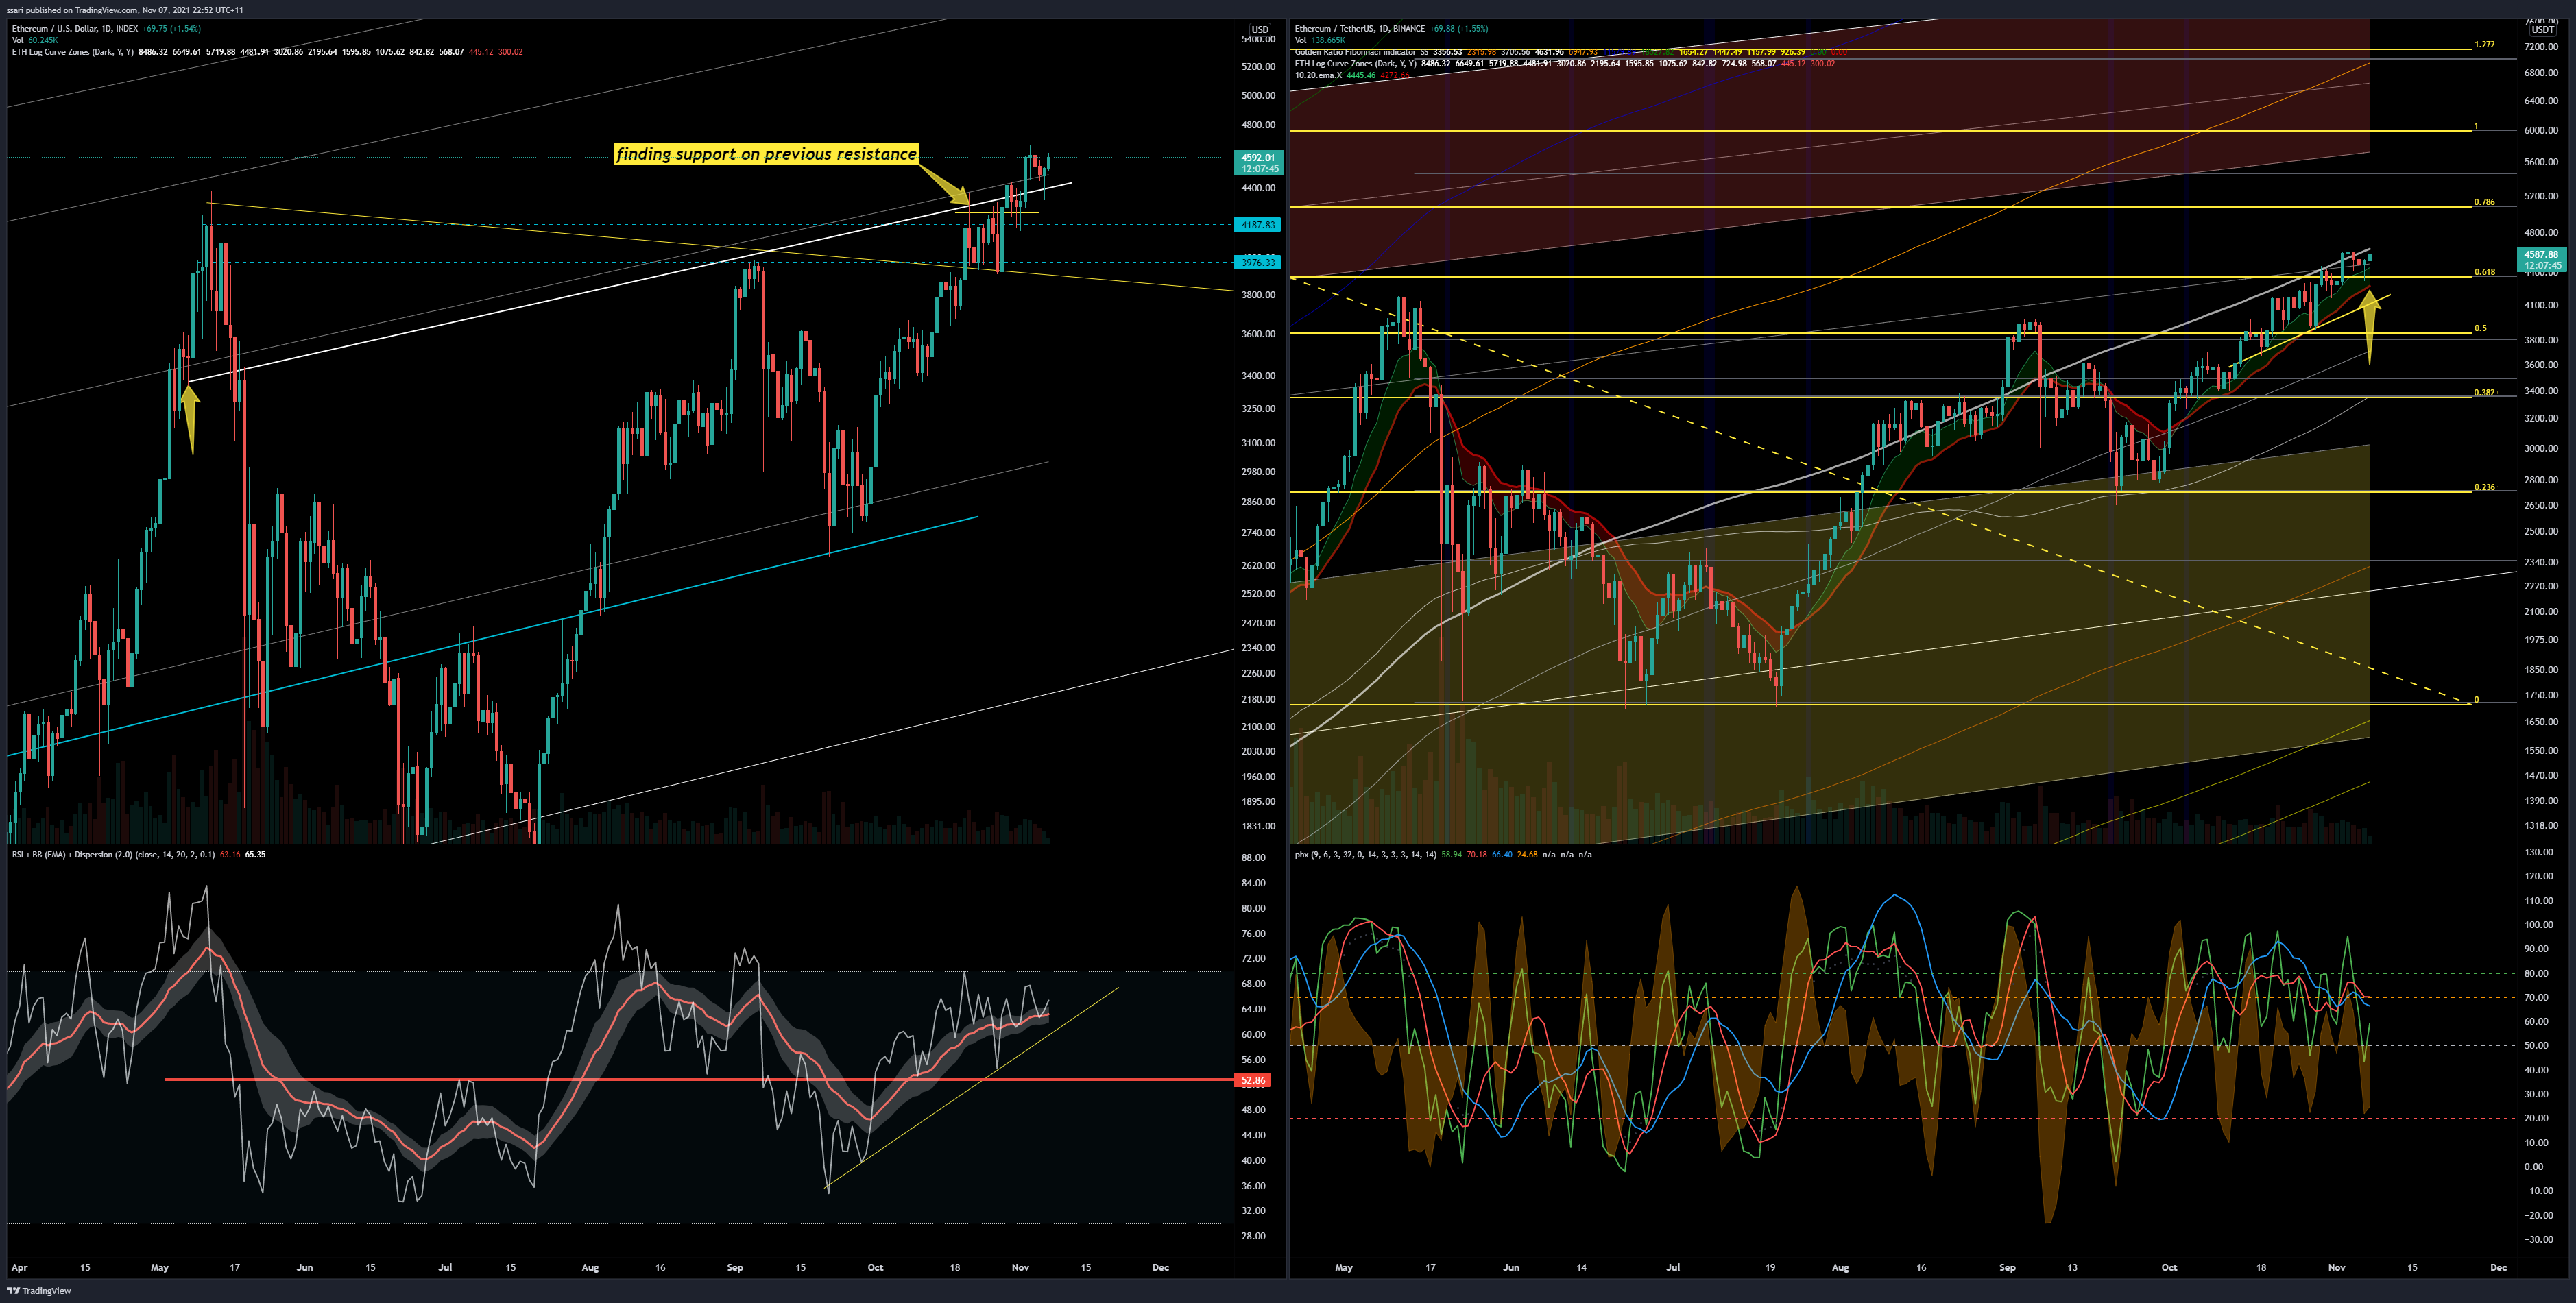
Ethereum Notes: ETH broke the $4.3k resistance band mentioned in the last letter and is now undergoing a rally. Fundamentals continue to strengthen. ETH price is far from being overheated, there’s a lot of legs left in its rally over the coming month(s).
BTC price action expectation: Bullish. Price is ready to move upwards in the coming two weeks. Often we see dips before strong rallies so short term traders need to account for this possibility.
Price action conviction: Medium to high.
All the best until the next letter.
-W
=======================
Where to buy BTC…my FTX referral >
link
It’s that part of the cycle again where I’m being asked where’s the best place to buy BTC…I use FTX due to their low fees and excellent liquidity. For limit orders the fee will be 0.02% or less, even as low as a 0.03% rebate (i.e.
you get paid when your order fills).
Previous report >
LINK
Comparing a number of indicators, it is evident that the bearish divergence on the daily is almost played out
There is a number of scenarios at this level which all point to consolidation and a move to the upside is more likely.
Analysis Breakdown
Macro: long term accumulation has peaked
This last week has seen long term holders (coins that have not moved for 5 months or more) start to decline. We have now in “peak accumulation” by long term holders.
I continue to watch this closely. Once the chart below drops out of the green “peak accumulation” band, historically a strong rally initiates but it also sets a countdown timer for the end of the rally. When this happens we’ll get clues to what may happen over the next 3-6 months. It’s still too early to get a read, apart from saying that the macro environment for BTC is bullish for months ahead.

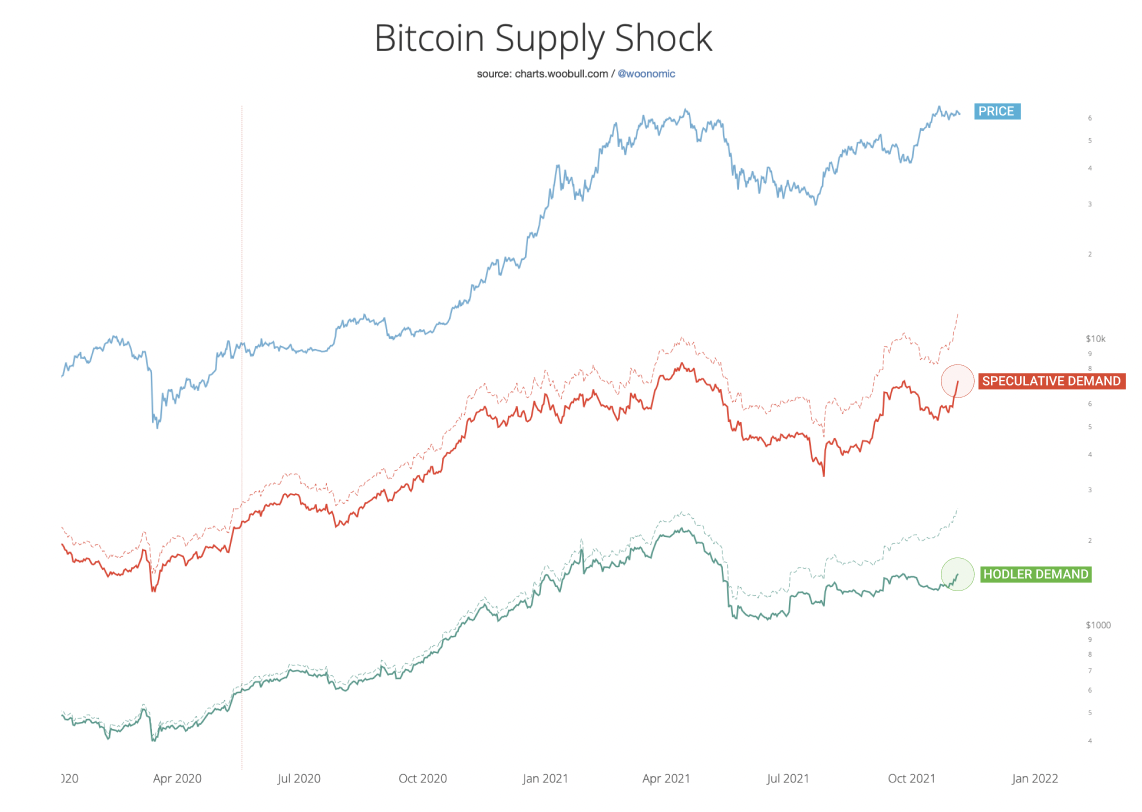
Short term: demand climbing, price no longer overheated.
While price action has been mainly sideways, both speculative and HODLer investor demand have been increasing. It’s a very healthy picture. If you recall the price rallied in the lead up to the ETFs launching on US stock exchanges. That rally outstripped investor fundamentals; investors have now closed the gap, with BTC price no longer overheated.
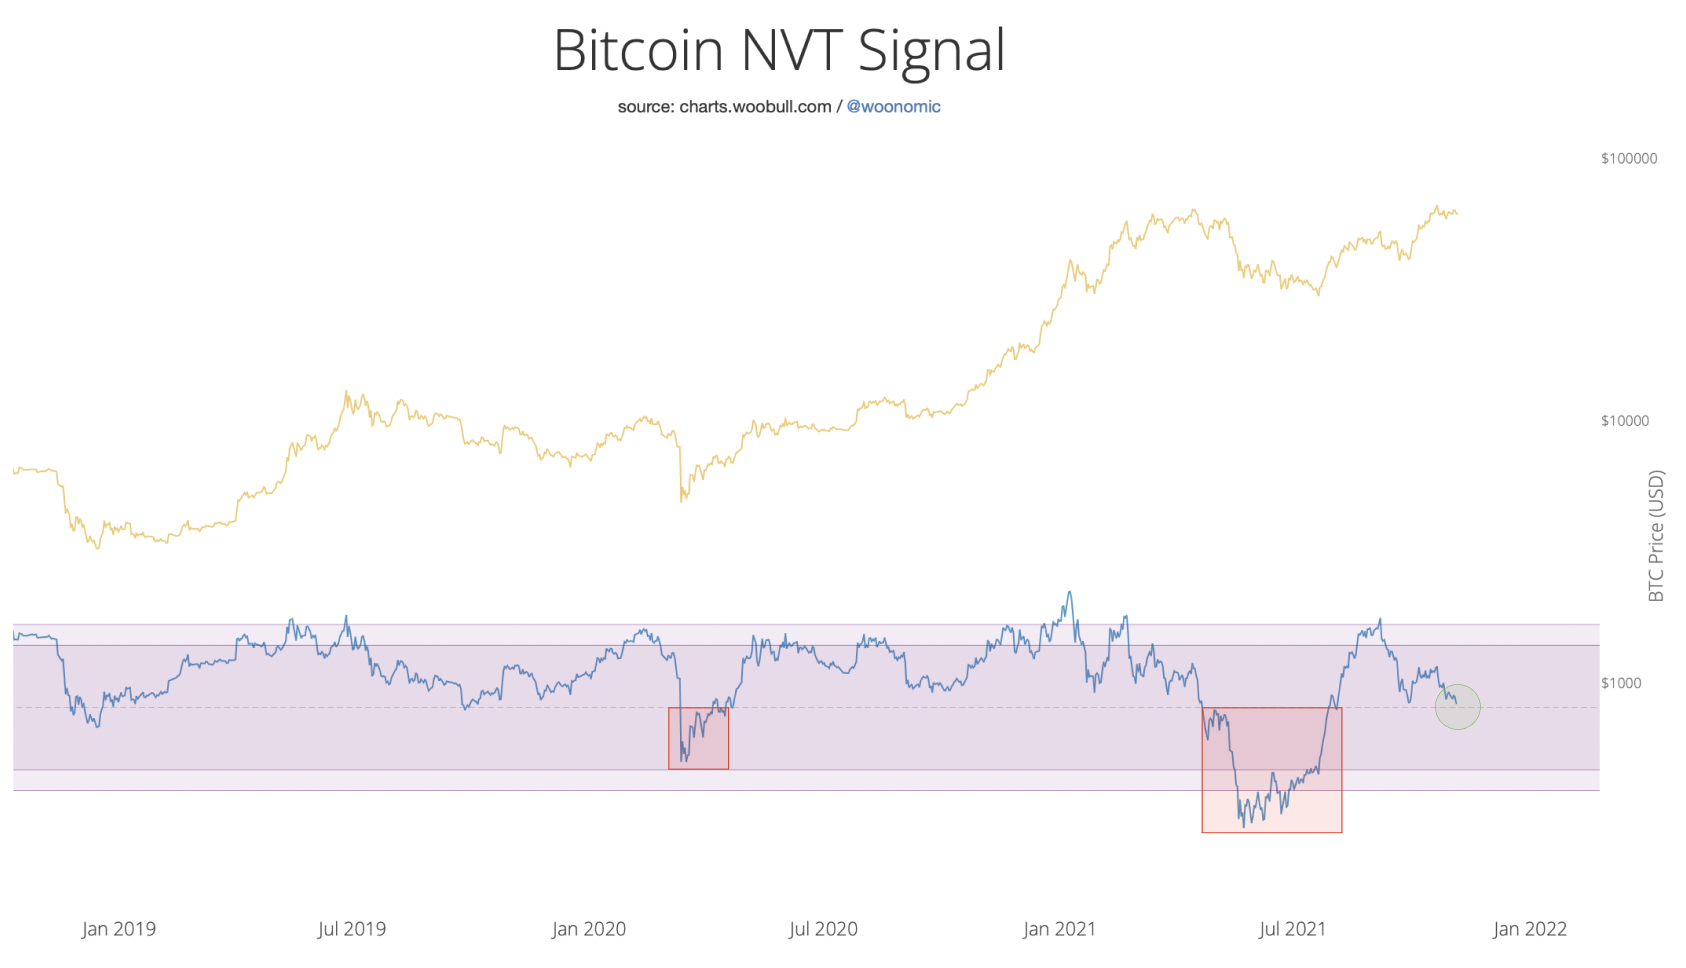
A good view of how things have cooled off from the overheated region comes from NVT Signal which gauges investor volume against BTC valuation. In the chart below we can see NVT Signal is now in the mid band which typifies a healthy “not overheated” region. Rallies during bull markets typically launch from this mid band. Historically we only drop below the mid zone during bearish phases of the market; there’s little danger of this right now due to the strength of investor demand, which I’ll cover in the next section.
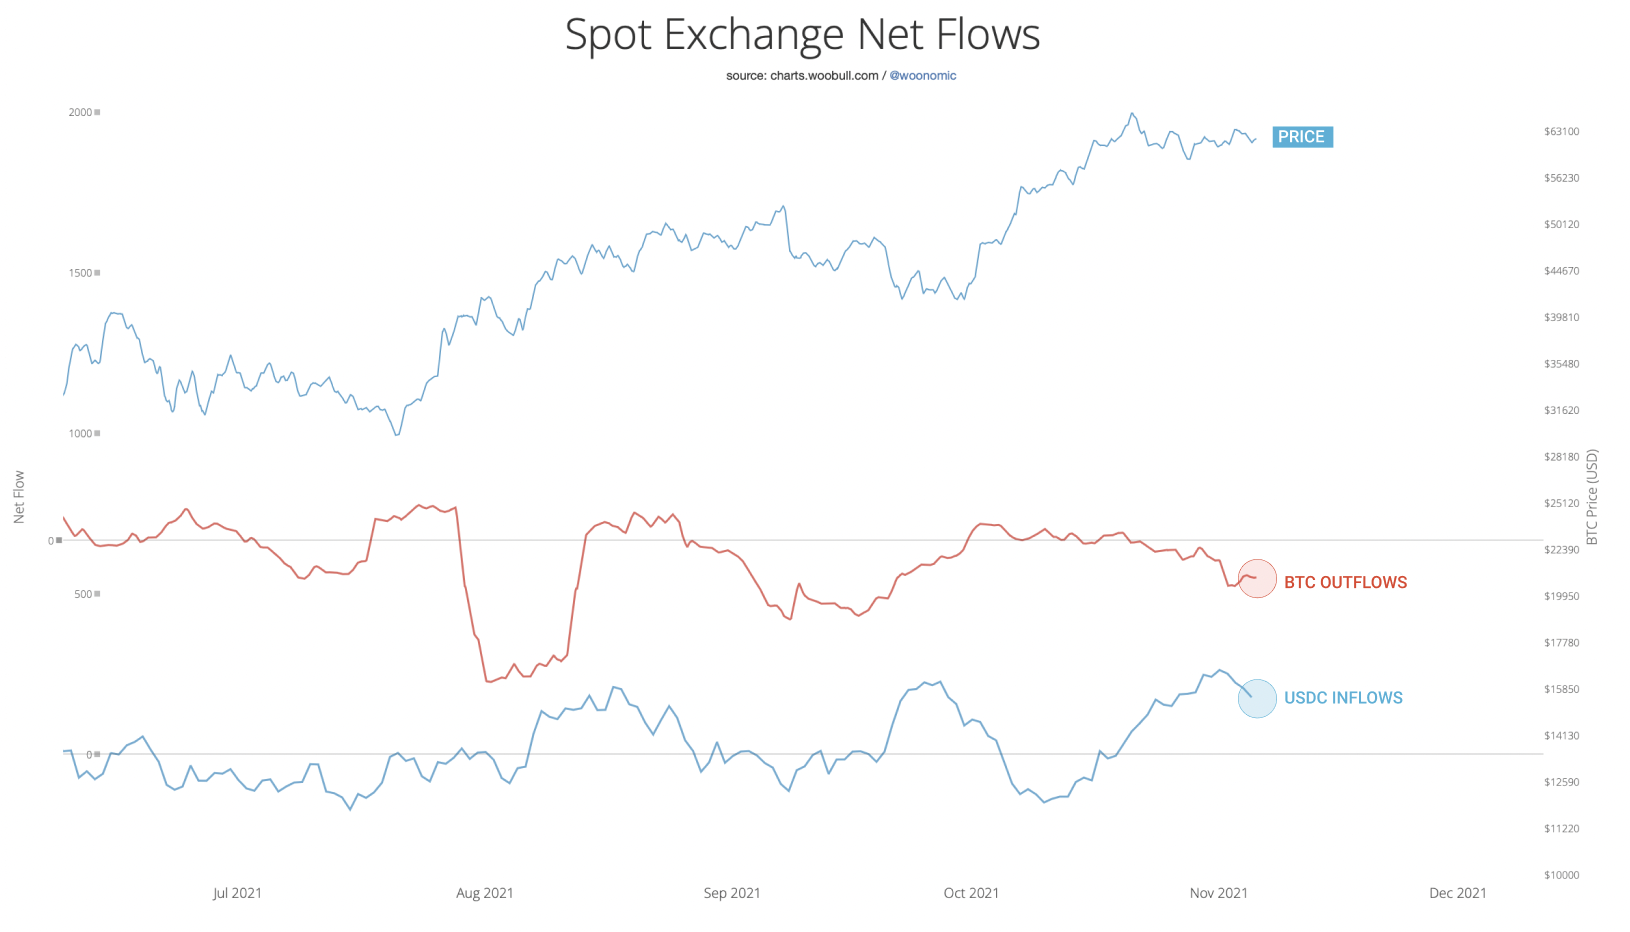
Short term: Exchange flows in a buying pattern
BTC continues to move off exchanges to cold storage while USDC inflows have been strong. Once again, a classic buying pattern by investors.
Here’s a heatmap view of the same data below. HODLer buying has been strong.
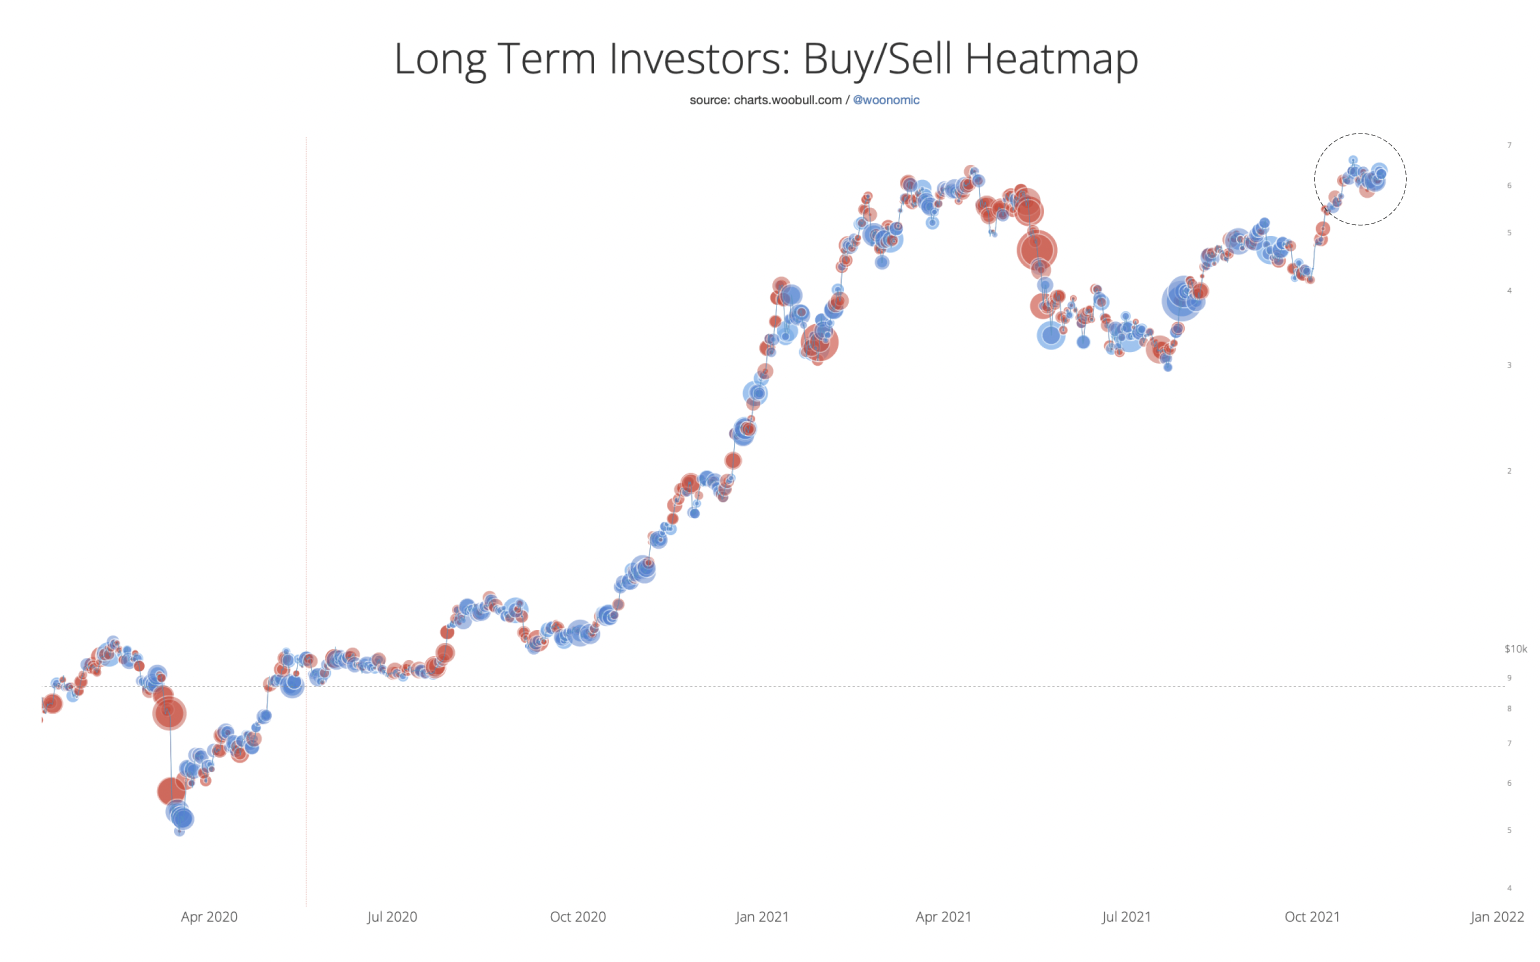
This heatmap combines exchange flows moving out to cold storage (a sign of long term investment) and also coins moving to holders who historically accumulate without selling.
Short term: Whale activity spotted
There have been some significant buys and sells between whales. I’d describe this as whales preparing their positions for the times ahead, often this happens before the next major moves in price.

ETH commentary
While BTC has been winding up for a bullish rally, ETH has been putting in even stronger fundamentals. ETH Supply Shock has broken into all-time-highs, well in excess of its price.

In our oscillator view below, we can see it’s in a very cool region which should give it plenty of legs in a rally before overheating.

The overall ETH environment should help alts perform well.
Observations on the chart below: Short term: It has found support on a major resistance fib line (left picture) and this equates to finding a trend on the daily 10 and 20 EMA ribbon (right picture)