SINGLE CANDLESTICK PATTERNS

These are some of the simplest patterns you can find, comprising just one trading period. Often, they form the building blocks of longer patterns.


Spinning Tops

A spinning top is formed when a candlestick has a long wick both above and below a narrow body. So the market had an extensive trading range, but little difference between its open and close. Unlike most candle patterns, it doesn’t really matter if a spinning top is formed on a red or green stick – there just needs to be a small body and a long wick.
In a spinning top, there’s a tug of war between buyers and sellers. But the bears and bulls are cancelling each other out, so there’s little in the way of actual movement.
Technical traders take spinning tops as an indication of weakness in an ongoing trend. If a market forms a spinning top after a lengthy bull run, then positive sentiment may be running out. After a downtrend, meanwhile, bullish opinion may be gaining strength.


Marubozu

Marubozu comes from the Japanese word for ‘bald’. It means a candlestick that has no wick whatsoever.
> A green marubozu opened and closed at its lowest and highest levels respectively> A red marubozu opened and closed at its highest and lowest levels respectively
If we visualize the movement within a green marubozu, there’d be no price action above or below the open and close prices:
As you can see, this makes a bald green stick an indication of clear bullish sentiment. Bulls pushed the market’s price higher with little fightback from bears.
If this occurs as part of an uptrend, technical traders see it as a sign that the upward movement will continue. If it happens after a downtrend, a reversal may be on the cards.
Red marubozu, meanwhile, are the exact opposite. They tell you that bears were in almost total control of a session – and therefore that a downtrend could continue or an uptrend may reverse Marubozu comes from the Japanese word for ‘bald’. It means a candlestick that has no wick whatsoever.


DOJI

In a doji pattern, the open and close prices are exactly equal (or almost exactly equal). So the body appears as a very thin line – typically less than 5% of the total range of the period.
Like spinning tops, this can tell you that the bulls and bears have cancelled each other out by the end of the session.
There are four main types of doji to watch out for:
> Long-legged doji have a lengthy wick both above and below the body> Gravestone doji have a high wick above the body and nothing underneath> Dragonfly doji have a long wick beneath the body and little to no wick above it> Four-price doji have no wick at all
The four types of doji candlestick. From left to right: the long-legged doji, the gravestone doji, the dragonfly doji, and the four-price doji
Doji are often taken as an indication of an upcoming reversal. If a market forms a after an extensive uptrend, then it may be about to head back down. After a bear move, selling sentiment could be exhausted, meaning bulls are about to take over.


HAMMER

If a market forms a hammer after an extended move down, then technical traders believe that it might be about to mount a bullish fightback.
You can spot a hammer by its long wick below a comparatively short body, with little to no wick above. The body should be two to three times shorter than the lower wick.
This shows that the market hit a new low during the session, but bounced back and closed much higher. So while there was significant selling pressure, buyers stepped in to push back the bears before close.
While bearish sentiment is weakening, that doesn’t necessarily mean a reversal is imminent. So most technical traders will wait for a confirmation before opening a position on a hammer – usually a strong upward move in the next period


INVERTED HAMMER

Inverted hammers look exactly the same as hammers, just upside down. So there’s a comparatively short body underneath a high upper wick, with little range below.
They also appear after downtrends and are taken as a possible signal that a reversal is on the way. However, the price action within an inverted hammer is a little different.
The upper wick shows that buyers took control of the market within the session, but were met with resistance from the sellers. However, sellers were unable to push its price further down, meaning that bearish sentiment may be on the wane.
As with hammers, it’s best to wait for confirmation – usually in the form of a bullish candlestick immediately after – before opening a buy position.


HANGING MAN

A hanging man looks identical to a hammer, the only difference being where it crops up.
While a hammer appears after a bear market, a hanging man will do so after an uptrend. They’re taken as a sign that selling sentiment is growing against buyers, and therefore that a reversal may be coming soon.
Sellers had control of the market, but met strong resistance. However, that resistance only managed to keep the price in check, it didn’t continue the bull run. So sentiment may be about to swing.
A red hanging man is usually taken as a stronger signal than a green one – though both are considered bearish patterns.


SHOOTING STAR

A shooting star, meanwhile, is a doppelgänger of an inverted hammer. But like the hanging man, a shooting star will appear at the crest of an uptrend instead of the trough of a downtrend.
In a shooting star, the session starts with the bulls still in control. But bears take over, dragging the asset’s price back down.
> In a green shooting star, they’ve pulled it back to just above the open> In a red shooting star, they’ve pulled it down below the open
Both indicate that a reversal may be imminent. But like the hammer, inverted hammer and hanging man, it’s often a good idea to wait for signs of a new bear market before trading.


DOUBLE CANDLESTICK PATTERNS

When a signal is formed from two consecutive periods, it’s known as a double candlestick pattern. This is not as strong as an indicator with 3 candle stick combinations hence these often become a hint at upcoming trend reversals, but can also be used to identify continuations


ENGULFING

In the engulfing pattern, a candlestick is immediately followed by another larger one in the opposite direction.
> Bullish engulfing pattern
> Bearish engulfing pattern
> In the bullish engulfing, a red candle is dwarfed by the green one that follows it.

> Technical traders might take this as a sign that positive opinion is taking hold, so a significant move up may be on the way – particularly if a bullish engulfing appears after a period of consolidation.


> A bearish engulfing arises when a bullish stick is then swallowed by a subsequent bearish one. So negative opinion may be forming.


HARAMI

Harami is essentially a backwards engulfing pattern: a candlestick is followed by a much smaller one in the opposite direction.
The name harami comes from the Japanese for pregnant, because some believe that the pattern resembles a pregnant person.
In a bullish harami, a red candlestick is followed by a green one that is completely contained within the body of the previous candle. This is often taken as a sign that a downtrend may be ending.
In a bearish harami, the opposite happens: a green candle followed by a smaller red one. In both cases, the size of the second stick is used to determine the strength of the signal: the smaller the better.
If a harami is followed by a doji – the smallest possible candle body – then it’s known as a harami cross.


Homing pigeon

A bullish homing pigeon, meanwhile, looks similar to a harami – except that both candlesticks are red.
The second candle’s body is contained entirely within the first’s. This is taken as a sign that an uptrend may be about to commence.
Traders searching for homing pigeons will look for downtrends that are weakening or nearing a key point of support. Homing pigeons are considered less useful in highly volatile conditions.


Tweezers

In a tweezers pattern, two identical candlesticks in opposite directions appear after a bull or bear market. Tweezers are taken as a sign of an upcoming reversal.
The first candle in a tweezer matches the previous trend. So in an uptrend, it’d be green. It should have a short body at the top, with a lengthy wick beneath. In a downtrend, it’d be red with a short body at the bottom and a tall wick above.
The second candle is the opposite colour, but otherwise identical. So together, the two look like a pair of tweezers.


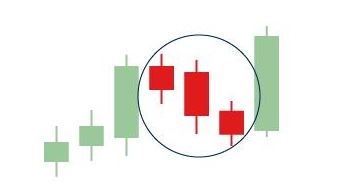
TRIPPLE CANDLESTICK PATTERNS

The longest patterns we’ll cover in this section are triples, which are made across 3 consecutive periods. Triple candlestick patterns are often seen as some of the strongest signals of an upcoming move, especially in context with other chart elements.

Morning Star
A morning star plays out as a market hits a point of indecision after an extended downward movement, then begins to recover. It consist of 3 candlesticks:
> A red on with a large body which is part of the downtrend
> A candle with a short body, often a spinning top, indicating that bulls are entering into the session
> A green stick with a tall body confirming that a reversal has began

Traders may take this as a sign that the recovery with turn into a lasting uptrend


Evening star

An evening star is the opposite of a morning star, showing a bull market that hits a point of indecision and then begins to retrace.
It looks the same as a morning star, but with a green candle at the beginning – after an extended uptrend – and a red one at the end.
Both evening and morning stars can be formed with a doji in the middle. This indicates a stronger period of indecision, and is sometimes taken as a sign that the subsequent move will be more pronounced.


3 WHITE SOLDIERS

The three white soldiers pattern appears after an extended downtrend and small consolidation. Technical traders use it as one of the clearest signs that the bear market is over.
The three soldiers are:
> A green candle after a downward move
> Another green candle, with a bigger body than the first and little to no upper wick
> A third green candle, with a body that at least matches the second and little to no wick whatsoever


3 BLACK CROWS

The three black crows pattern is the opposite of the three white soldiers. It appears after an uptrend, consists of three consecutively longer red candles and is taken as a strong signal that the bull market is over.
The second candle should have a short or non-existent lower wick, and the third should have close to no wick at all.
A technical trader may take the three black crows as an opportunity to open a short position to attempt to profit from the following bear run.


3 INSIDE UP

The three inside up pattern is another trend reversal indicator, appearing after a downtrend and signaling the beginning of a potential reversal.
The three candles in an inside up pattern are:
> A substantial red one that continues the previous downtrend
> A green stick with a body that closes at least halfway up the previous candle’s – so the market has recovered half of the last period’s losses
> A green candle that closes above the high of the first one
Buyers should now have overpowered sellers, arresting the market’s decline and possibly kicking off a new bull trend


3 INSIDE DOWN
The three inside down is a reversed inside up. It consists of a long green candle, followed by a red candle that closes at least halfway down the one before. Then another red candlestick that closes below the low set by the first.
An example of the three inside down pattern:
When a three inside down appears after a bull market, traders who watch for patterns might see an opportunity for a profitable short position.


RISING OR FALLING 3

The rising three (or rising three methods) is a candlestick pattern that occurs within an uptrend, and is used to identify an impending continuation.
An example of the rising three pattern:
The three sticks within a rising three all occur after a green candle with a large body. They are all typically bearish, and trade within the range set by the previous bullish candle. Here, the uptrend has paused while buyers wait to see whether sentiment is turning.
But after the rising three, another large green stick shows that the bull market is back on.
In a falling three, the opposite happens. A tall red candle is followed by three smaller green ones – then another tall red candle resumes the bear run.